
Why a weekend break below $62,500 could unleash a Bitcoin selling wave toward $58,500

Bitcoin trades near $62,900 heading into the weekend, having touched an intraday low of $62,538 on Aug. 14. That low effectively tested the $62,500 to $62,560 zone that has held as the floor of a five-week trading range between roughly $62,000 and $66,000.
Bitfinex found Bitcoin tested the $65,000 to $65,500 region six times between Aug. 5 and Aug. 10 without producing a single daily close above $65,000. Bitcoin sits about 0.5% above its floor and needs roughly 3.3% to reclaim its ceiling.
| Level | Distance from ~$62,900 | Role in weekend setup | Why it matters |
|---|---|---|---|
| $62,500-$62,560 | ~0.5%-0.6% lower | Immediate floor / trigger | BTC already tested this zone intraday on Aug. 14 |
| $60,000 | ~4.6% lower | First downside destination | Psychological support if the range floor fails |
| $58,000-$59,000 | ~6%-8% lower | Deeper failure zone | Next structural area if $60k does not hold |
| $63,500 | ~1% higher | First recovery hurdle | Shows BTC has stabilized, but not escaped the range |
| $64,500-$65,500 | ~2.5%-4.1% higher | Real reclaim zone | Rejected six times between Aug. 5 and Aug. 10 |
| $66,000-$68,700 | ~5%-9% higher | Bullish extension zone | Would shift the structure from defense to recovery |
A week of macro relief Bitcoin failed to convert
July payrolls fell by 23,000, and May and June were revised down by a combined 103,000. July CPI rose just 0.1% month on month, with headline inflation easing to 3.4% year on year and core inflation at 2.5%.
Headline producer prices came in flat for July, though the underlying measure excluding food, energy and trade services still rose 0.4% on the month. Retail sales then fell 0.6% on Aug. 14 morning, the first monthly decline in nine months, and the combined data pushed September rate-hike odds down to 31%, from 59% a week earlier.
Equities absorbed that relief, with the S&P 500 closing at a record on Aug. 13. Bitcoin lagged, unable to sustain a move through $64,000 to $65,000 even as the macro backdrop turned friendlier.
The central bank held rates at 3.50% to 3.75% on July 29, with three members dissenting in favor of a hike. Softer data moved market odds without moving the committee itself.
Heavy supply sits where price is stuck
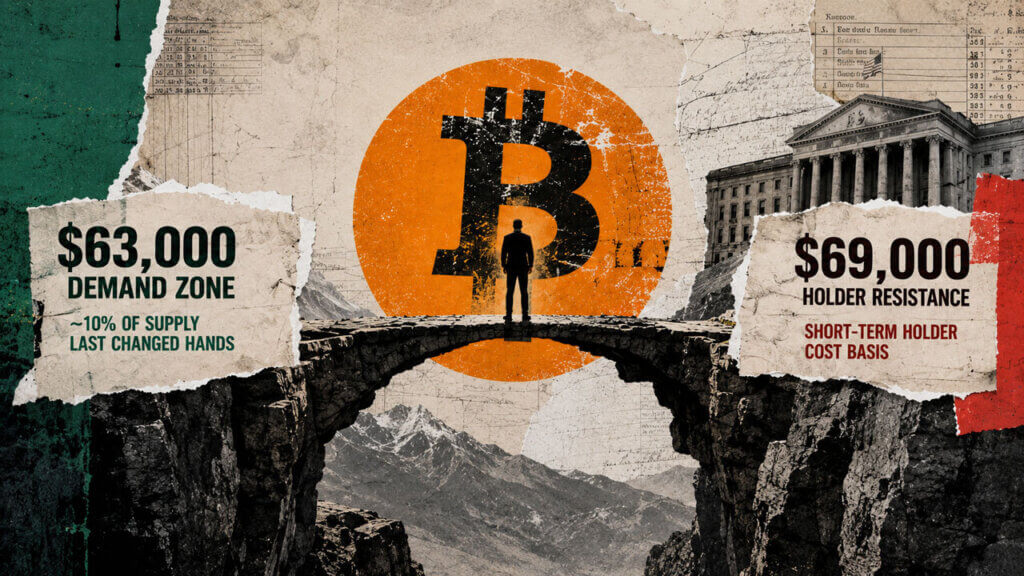
Bitfinex puts roughly 1.79 million BTC, about 8.93% of circulating supply, inside the $62,000 to $65,000 band at cost basis. That concentration turns the current range into a break-even zone where a large group of holders keeps changing its mind about selling.
Long-term holder supply fell by about 210,000 BTC from its July 29 peak, the first weekly decline of 2026 and the steepest two-week drop since December 2024. Bitfinex’s long-term holder profitability measure printed 0.86, 0.90 and 0.86 across Aug. 9 through 11, implying coins moving from that cohort were sold at a 10% to 14% loss.
The selling looks concentrated among the youngest long-term holders, whose average acquisition cost sits closer to $71,000 to $76,000.

Wallets holding more than 1,000 BTC reached a 2026 high of 3.06 million BTC on Aug. 8, pointing to recent buyers realizing losses on every approach toward $65,000, a narrower pattern than a broader wave of long-held coins hitting the market.
| Market layer | Key data point | Signal | Impact on BTC |
|---|---|---|---|
| Cost-basis supply | 1.79 million BTC between $62k-$65k | Heavy break-even congestion | Holders may sell into rallies near their entry price |
| Share of supply | ~8.93% of circulating BTC | Large concentration of coins | Makes the range more important than a normal chart zone |
| Long-term holder supply | Down ~210,000 BTC from July 29 peak | Distribution from older cohorts | Adds supply while price is already near support |
| LTH SOPR | 0.86, 0.90, 0.86 from Aug. 9-11 | Coins moved at 10%-14% loss | Suggests stress among recent long-term buyers |
| Young LTH cost basis | ~$71k-$76k | Recent buyers underwater | Explains selling into $65k attempts |
| 1,000+ BTC wallets | 3.06 million BTC, 2026 high | Larger wallets accumulating | Selling is not broad capitulation, but rotation |
The ETF channel goes dark for the weekend
US spot Bitcoin ETFs recorded about $289 million in net outflows this week, reversing some of the positive flows it recorded in the week of Aug. 7. On its own, this outflow signals that institutional demand for BTC remains choppy.
Those funds hold $77.3 billion in net assets, equal to about 6.07% of Bitcoin’s market cap, and none of it trades again until Monday. Bitcoin keeps trading through the weekend regardless, leaving the market to defend its floor with crypto-native buyers alone for 48 hours.
The UAE accused Iran of attacking two ADNOC vessels in the Strait of Hormuz on Aug. 14, with no injuries reported, as tensions around the waterway continue building. Brent crude rose toward $88.50, and the strait carries roughly 20% of global oil and LNG shipments.
A weak retail sales print argues against a September hike, while an oil shock argues for sticky inflation and yields.
Cleveland Fed nowcasts still had core PCE running near 3.3%, even with this week’s softer inflation data already in hand. Any Hormuz escalation over the weekend would hit Bitcoin first, since it is the only major asset still trading while everything else stays closed.

How Bitcoin’s weekend breaks
The bull case has Bitcoin wicking below $62,500 without holding there, reclaiming $63,500 and then pushing through the $64,500 to $65,500 zone that has rejected it six times already.
A genuine reclaim of that ceiling would prove native demand can defend the range without the ETF market, pulling shorts and de-risked longs back in and opening a path toward $66,000 to $68,700.
The bear case has $62,500 failing on a sustained basis, something thin weekend liquidity could accelerate quickly. Bitcoin’s first stop is $60,000. Holding there sets up a sharp rebound back toward $62,500 to $64,000.
| Scenario | Trigger | Likely price path | Confirmation signal | What it would mean |
|---|---|---|---|---|
| Base case: range chop | $62.5k holds, but $64.5k-$65.5k rejects again | $62.5k-$64.5k | Repeated bounces without volume follow-through | Native demand is enough to prevent breakdown, but not enough to reverse trend |
| Bull case: failed breakdown | BTC wicks below $62.5k, then reclaims $63.5k | $64.5k-$65.5k, then $66k-$68.7k | Sustained move through the six-time rejection zone | Weekend buyers absorb supply without ETF support |
| Bear case: liquidity break | Sustained trade below $62.5k | $60k, then $58k-$59k if $60k fails | Failed retest of $62.5k from below | Thin weekend books turn support loss into acceleration |
| Shock case: Hormuz escalation | New shipping/oil-market headline while markets are shut | Fast move outside normal range | Brent spike, risk-off flows, BTC volatility jump | Bitcoin reprices geopolitical risk before traditional markets reopen |
A convincing break turns $58,000 to $59,000 into the next reasonable target, since a failed defense of a round number in thin liquidity tends to keep pushing price toward the next obvious structural level.
Bitcoin already received the macro relief it needed this week and still failed to hold above its own floor. The weekend now tests whether native buyers can do what a full week of favorable data could not.
The post Why a weekend break below $62,500 could unleash a Bitcoin selling wave toward $58,500 appeared first on CryptoSlate.